A Statistical Similarity Measure for Aggregate Crowd Dynamics
Stephen J. Guy, Jur van den Berg, Wenxi Liu, Rynson Lau, Ming C. Lin and Dinesh Manocha
![]()
|
We present an information-theoretic method to measure the similarity between a given set of observed, real-world data and visual simulation technique for aggregate crowd motions of a complex system consisting of many individual agents. This metric uses a two-step process to quantify a simulator's ability to reproduce the collective behaviors of the whole system, as observed in the recorded real-world data. First, Bayesian inference is used to estimate the simulation states which best correspond to the observed data, then a maximum likelihood estimator is used to approximate the prediction errors. This process is iterated using the EM-algorithm to produce a robust, statistical estimate of the magnitude of the prediction error as measured by its entropy (smaller is better). This metric serves as a simulator-to-data similarity measurement. We evaluated the metric in terms of robustness to sensor noise, consistency across different data sets and simulation methods, and correlation to perceptual metrics. |
[Downloads]
Paper [PDF 3.6MB] (Proc. of SIGGRAPH Asia 2012)
Video [MP4 78MB] [YouTube]
[Entropy Metric]

|
||
|
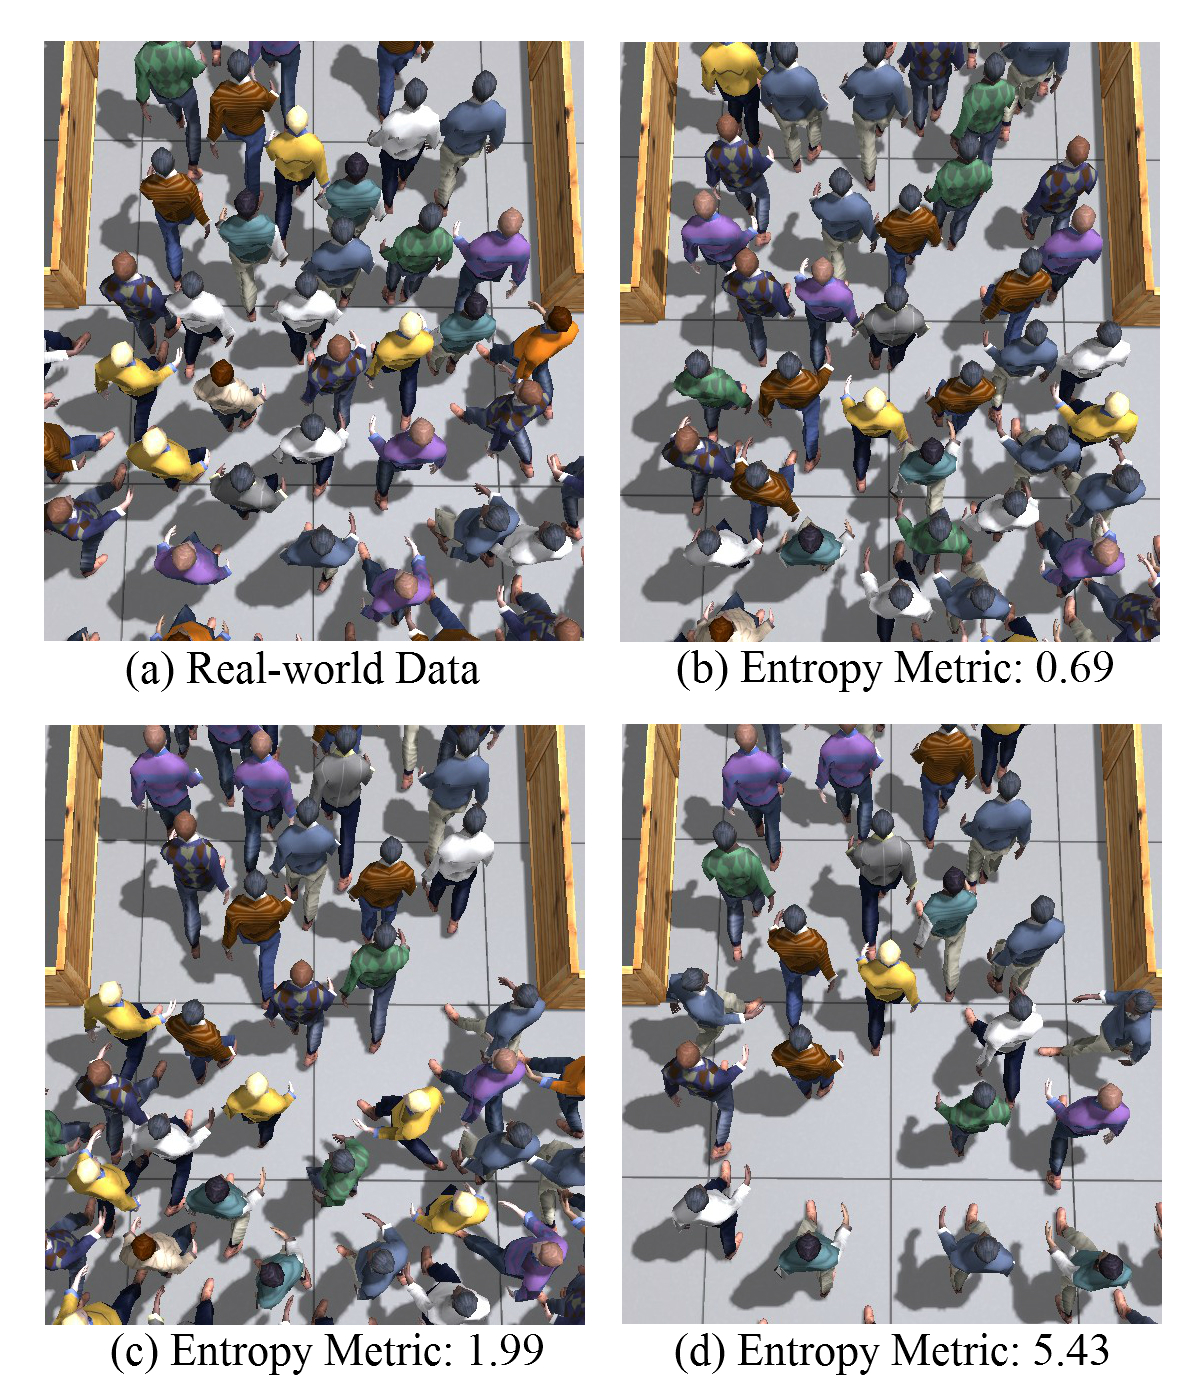
Street Crossing Scenario A comparison between a rendering of real-world crowd data (a) (from van Gool et al.), and stills from three different simulation algorithms applied to the same scenario (b-d). Our entropy metric is used to compare the accuracy of each simulation algorithm with respect to the data over the entire duration of the simulation. A small value of the metric, as in (d), indicates a better match to the data. Differences between the simulations are highlighted with circles. |
||
[Dense Scenarios]

|
Bottleneck Scenario Data of 200-300 people walking through a narrow bottleneck (gathered by Seyfried et al.). (a) shows a still image from a rendering of the data. (b-d) show stills at the same time from various simulations. The RVO simulation in (b) matches the data well, and has a good entropy score. The RVO simulation shown in (c) matches the data less well, and has a worse entropy score. The social force simulation shown in (d) matches very poorly, and has a very high entropy score. |